GitSnap
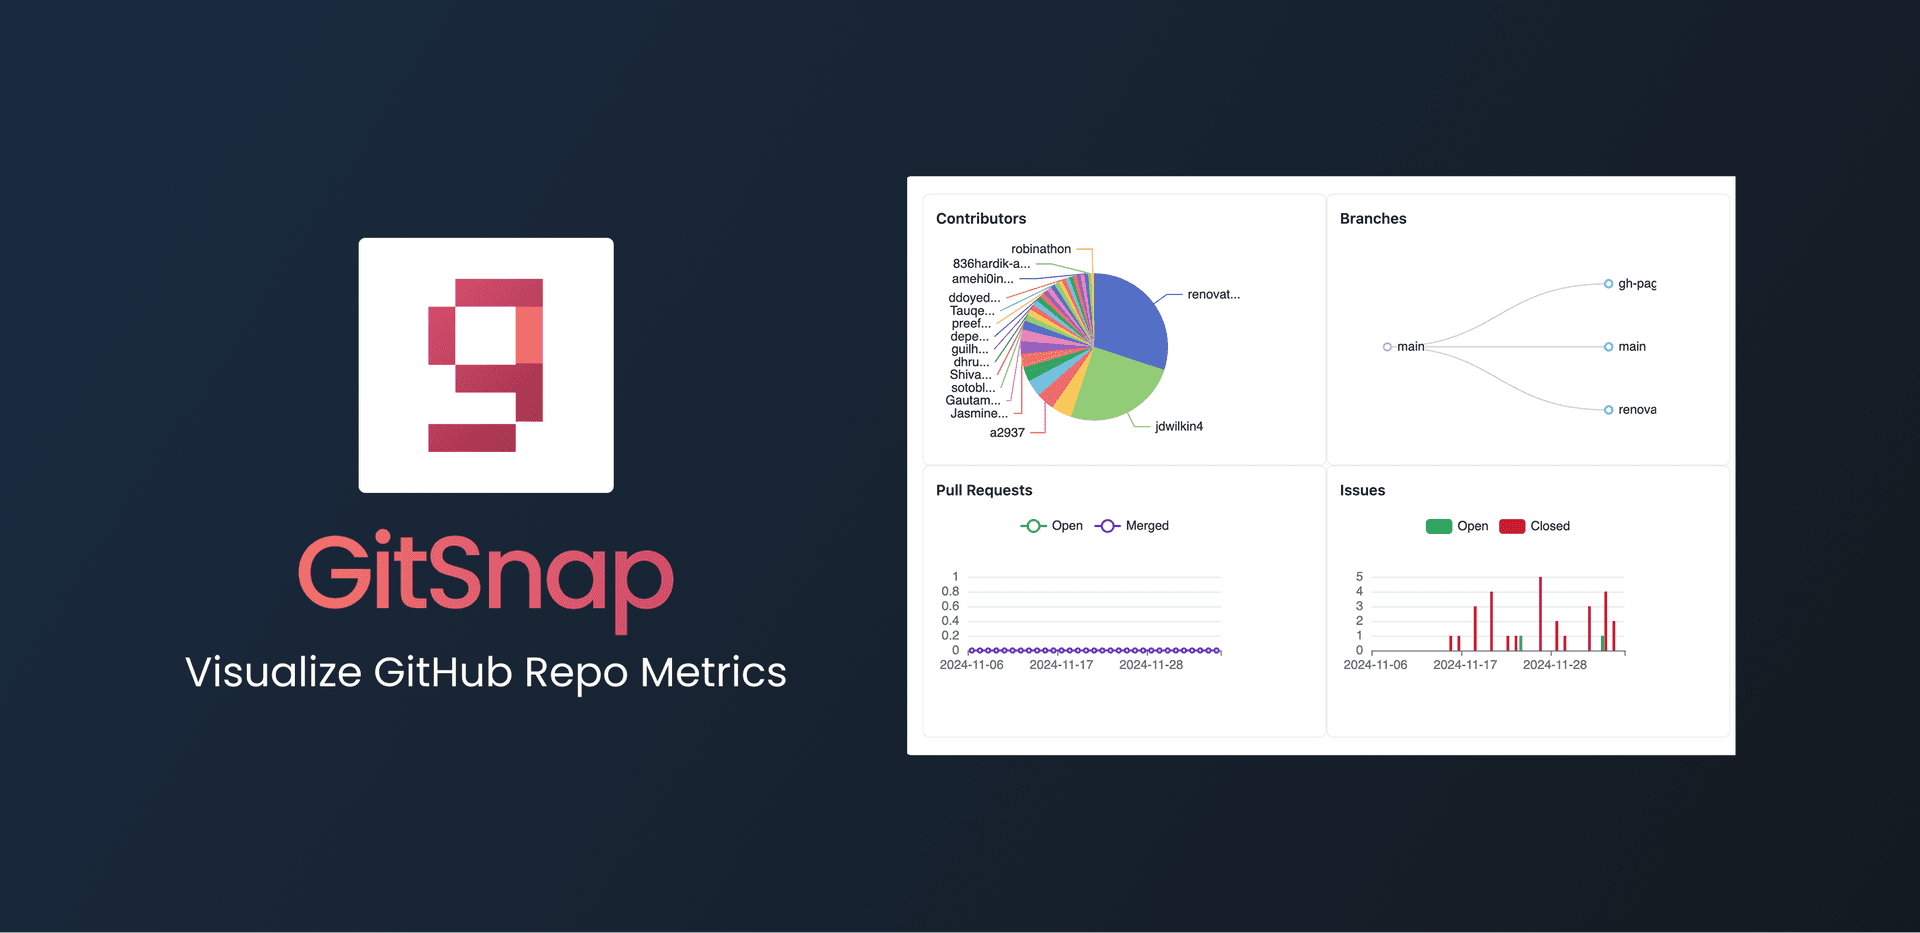
GitSnap is a Chrome extension I developed to elevate the GitHub user experience by transforming repository data into engaging, interactive charts and graphs. Inspired by the simplicity and utility of CSS Viewer, GitSnap leverages the Echarts interactive charting and data visualization library to provide instant insights into open source projects activity by generating line, pie, tree, and bar charts.
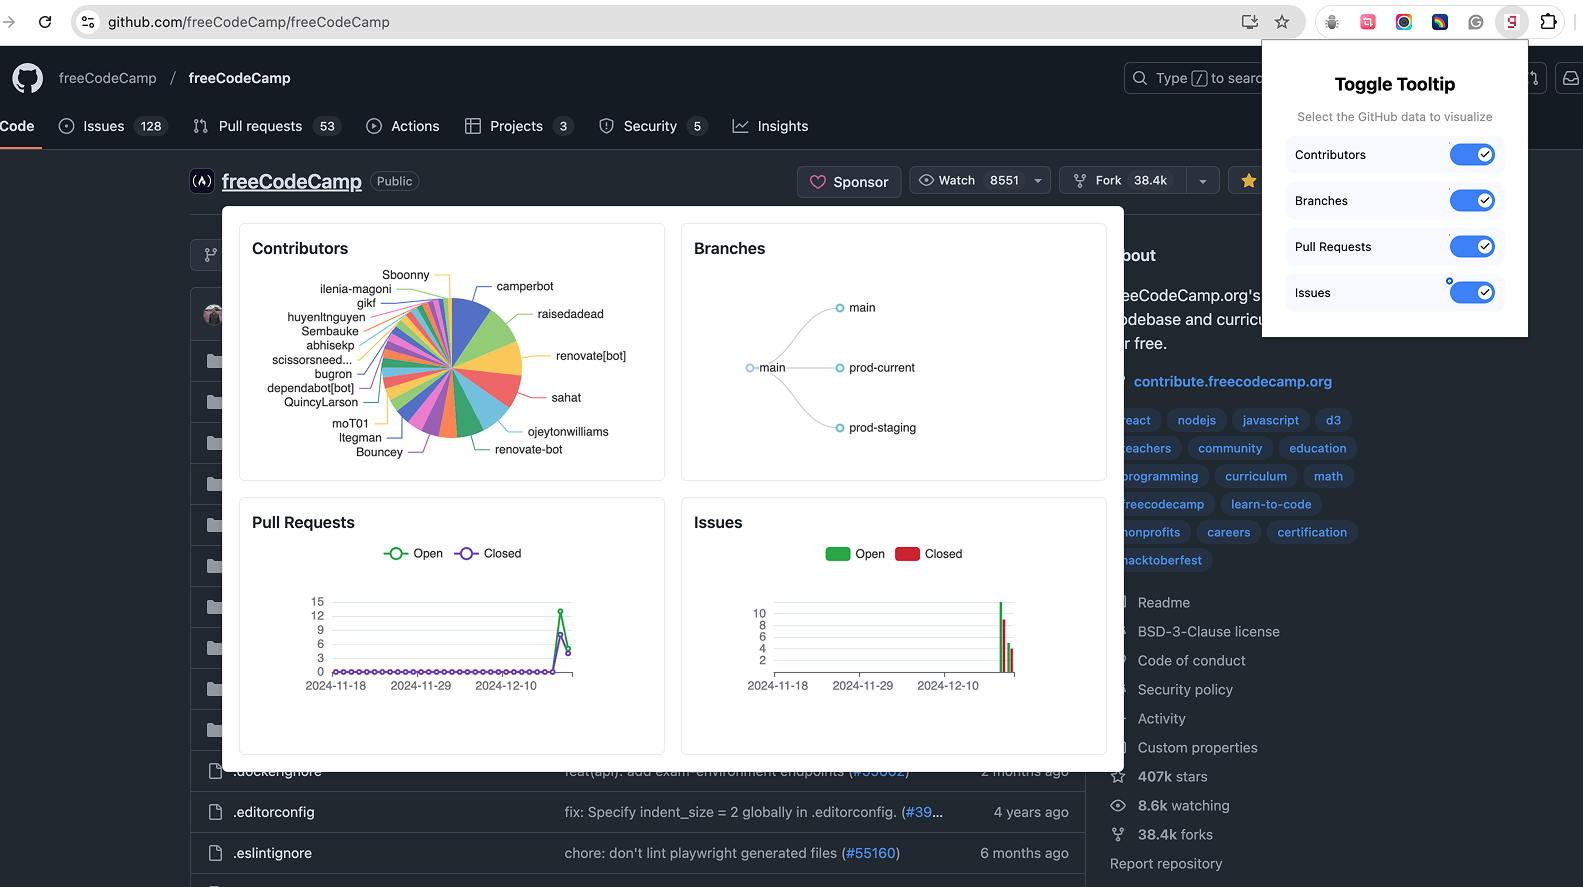
By simply hovering over repository links on GitHub, users can access real-time visual summaries of contributor activity, pull request trends, issue statuses, and branch structures. This tool caters to developers, project managers, and open-source enthusiasts seeking to quickly assess repository metrics and make data-informed decisions with ease.
TECHNOLOGIES
- Frontend Languages: HTML, CSS, JavaScript
- Visualization Library: Echarts
- Browser APIs: Web Extension API (tabs, storage)
CORE FEATURES
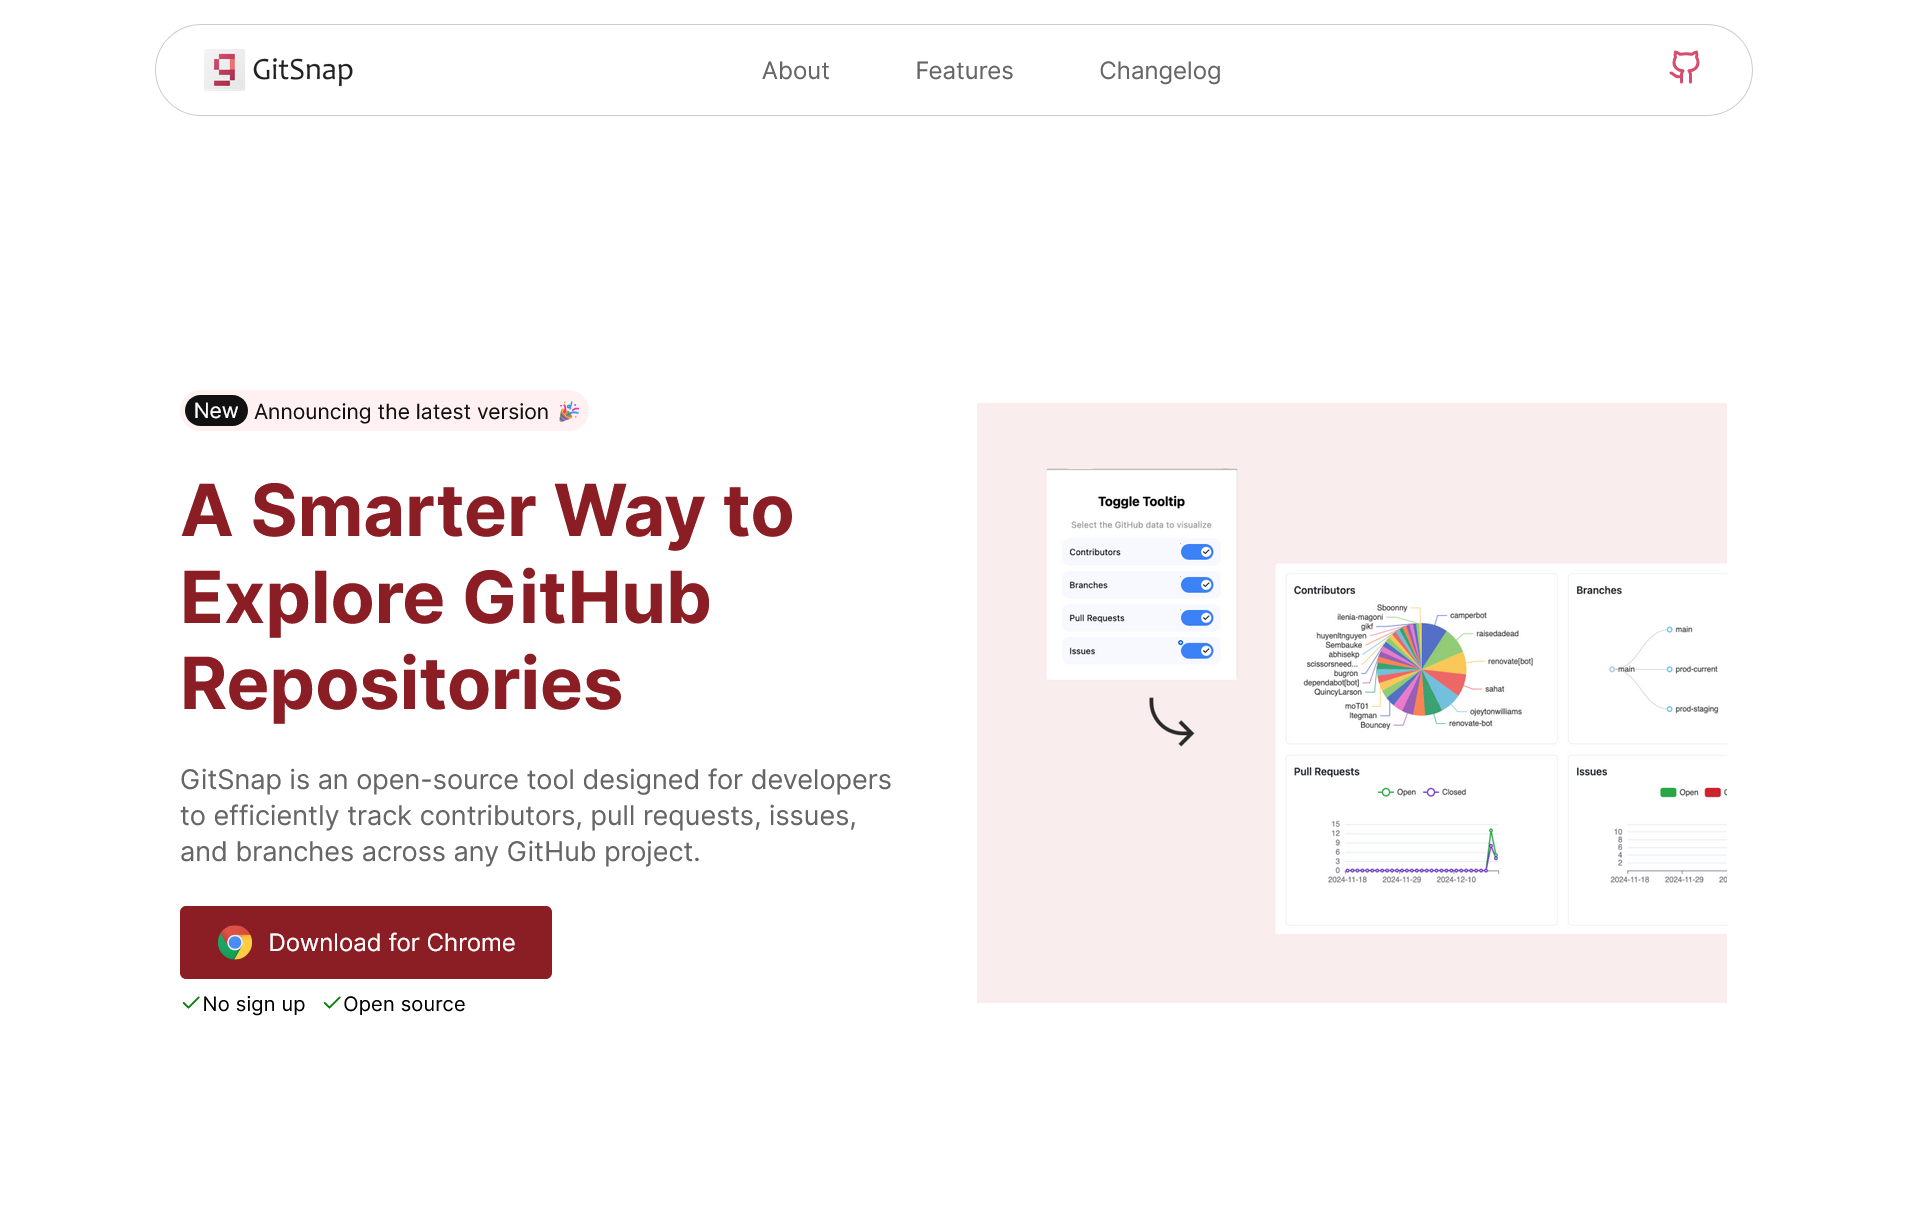
- Interactive Toggle Controls: Users can customize which charts to display. Selecting among Contributors, Pull Requests, Issues, Branches, or any combination for tailored insights.
- Contributor Metrics: Visualize individual and aggregate contributor involvement with detailed distribution analytics.
- Pull Request Trends: Monitor the lifecycle of pull requests, tracking open, merged, and closed states over last 30 days.
- Issue Tracking: Analyze open and resolved issues to understand project progress and bottlenecks within a month period.
- Branch Hierarchy Visualization: Explore branch relationships and structures for repository management clarity.
DEVELOPMENT PROCESS
The extension was architected with core web technologies and designed for seamless integration into the GitHub UI. Managing communication between background scripts and content scripts was achieved through the Web Extension API, ensuring responsive and efficient updates as users interact with the tool.
CHALLENGES & SOLUTIONS
- Script Role Differentiation: Early development phases involved difficulty distinguishing between background scripts and content scripts, which caused integration issues. Resolving this clarified extension architecture, improving script functionality and reliability.
- Visualization Library Selection: Initial attempts to integrate D3.js were hindered by its complexity and absence of minified JavaScript files for local development. Switching to Echarts offered more comprehensive documentation and a collection of minified versions of JavaScript source files, accelerating development and enhancing chart interactivity with faster loading and less bandwidth usage.
LESSONS LEARNED
- Mastering web extension architecture is crucial for effective interaction between various scripts and background processes.
- Choosing libraries with strong community support and clear documentation can drastically streamline project delivery.
- Data visualization enriches user engagement, turning complex datasets into actionable insights.
TAKEAWAYS
GitSnap currently serves a growing user base, with roughly 9 weekly active users benefiting from its intuitive visualizations. The project has a dedicated website that educates users about its capabilities and answers common questions. This project not only sharpened my expertise in browser extension development but also strengthened my ability to translate complex data into accessible, actionable formats.